The challenge
Turn a school dataviz brief into visuals that explain information without drowning in charts.
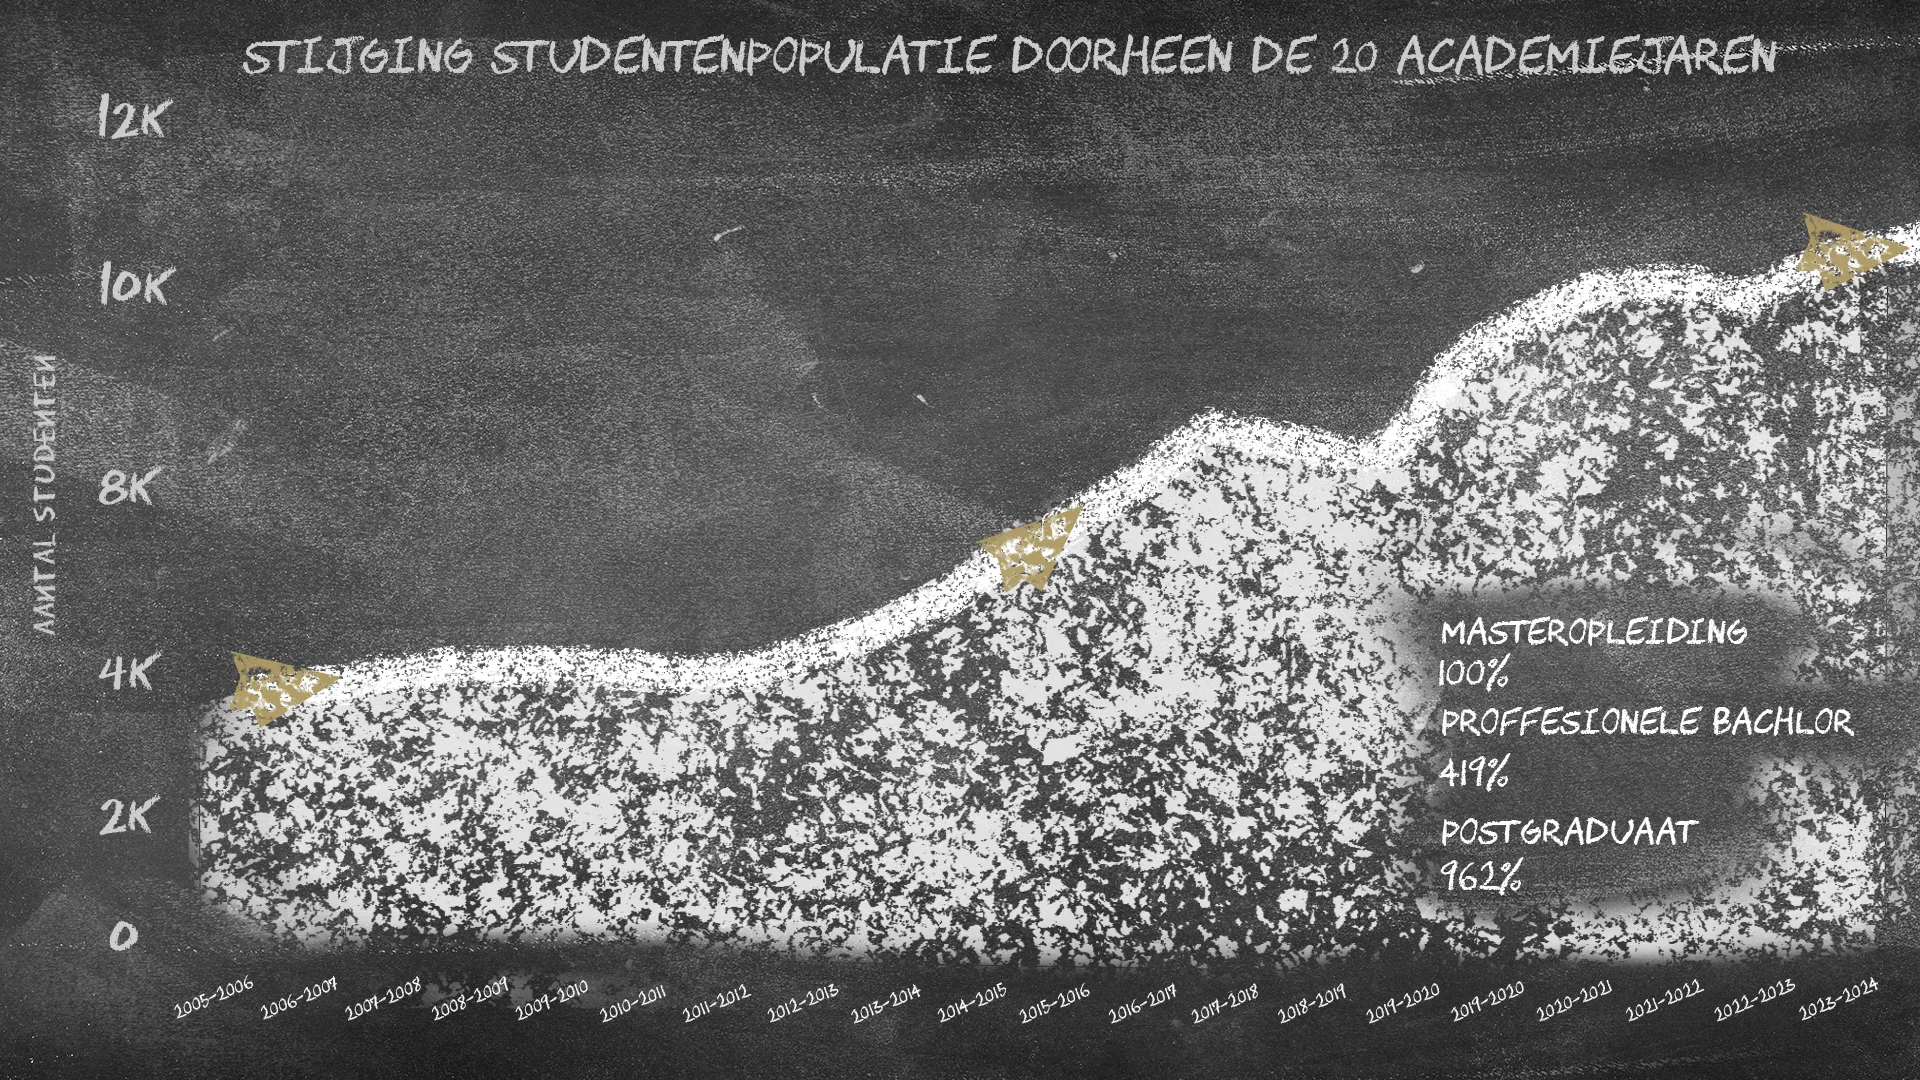
School dataviz project using Blender and Photoshop — chart hierarchy and dimensional treatments that make dense data approachable.
SECTORSECTOR
Data Visualization
WHAT I DIDWHAT I DID
Data Visualization Design, Art Direction
TECHNOLOGIESTECHNOLOGIES
Photoshop, Illustrator
DELIVERABLESDELIVERABLES
Chart visuals · 3D data treatments · Presentation boards
ROLE & EXECUTIONROLE & EXECUTION
Data visualisation · ~5 min. read
Turn a school dataviz brief into visuals that explain information without drowning in charts.
I used Blender and Photoshop to build hierarchy, colour coding and dimensional chart treatments.
A dataviz project that makes dense information feel approachable and designed.
Need a tailored solution for your brand? Let's scope it out together.
Inquire about DesignYour project could be next