The challenge
Turn a school dataviz brief into visuals that explain information without drowning in charts.
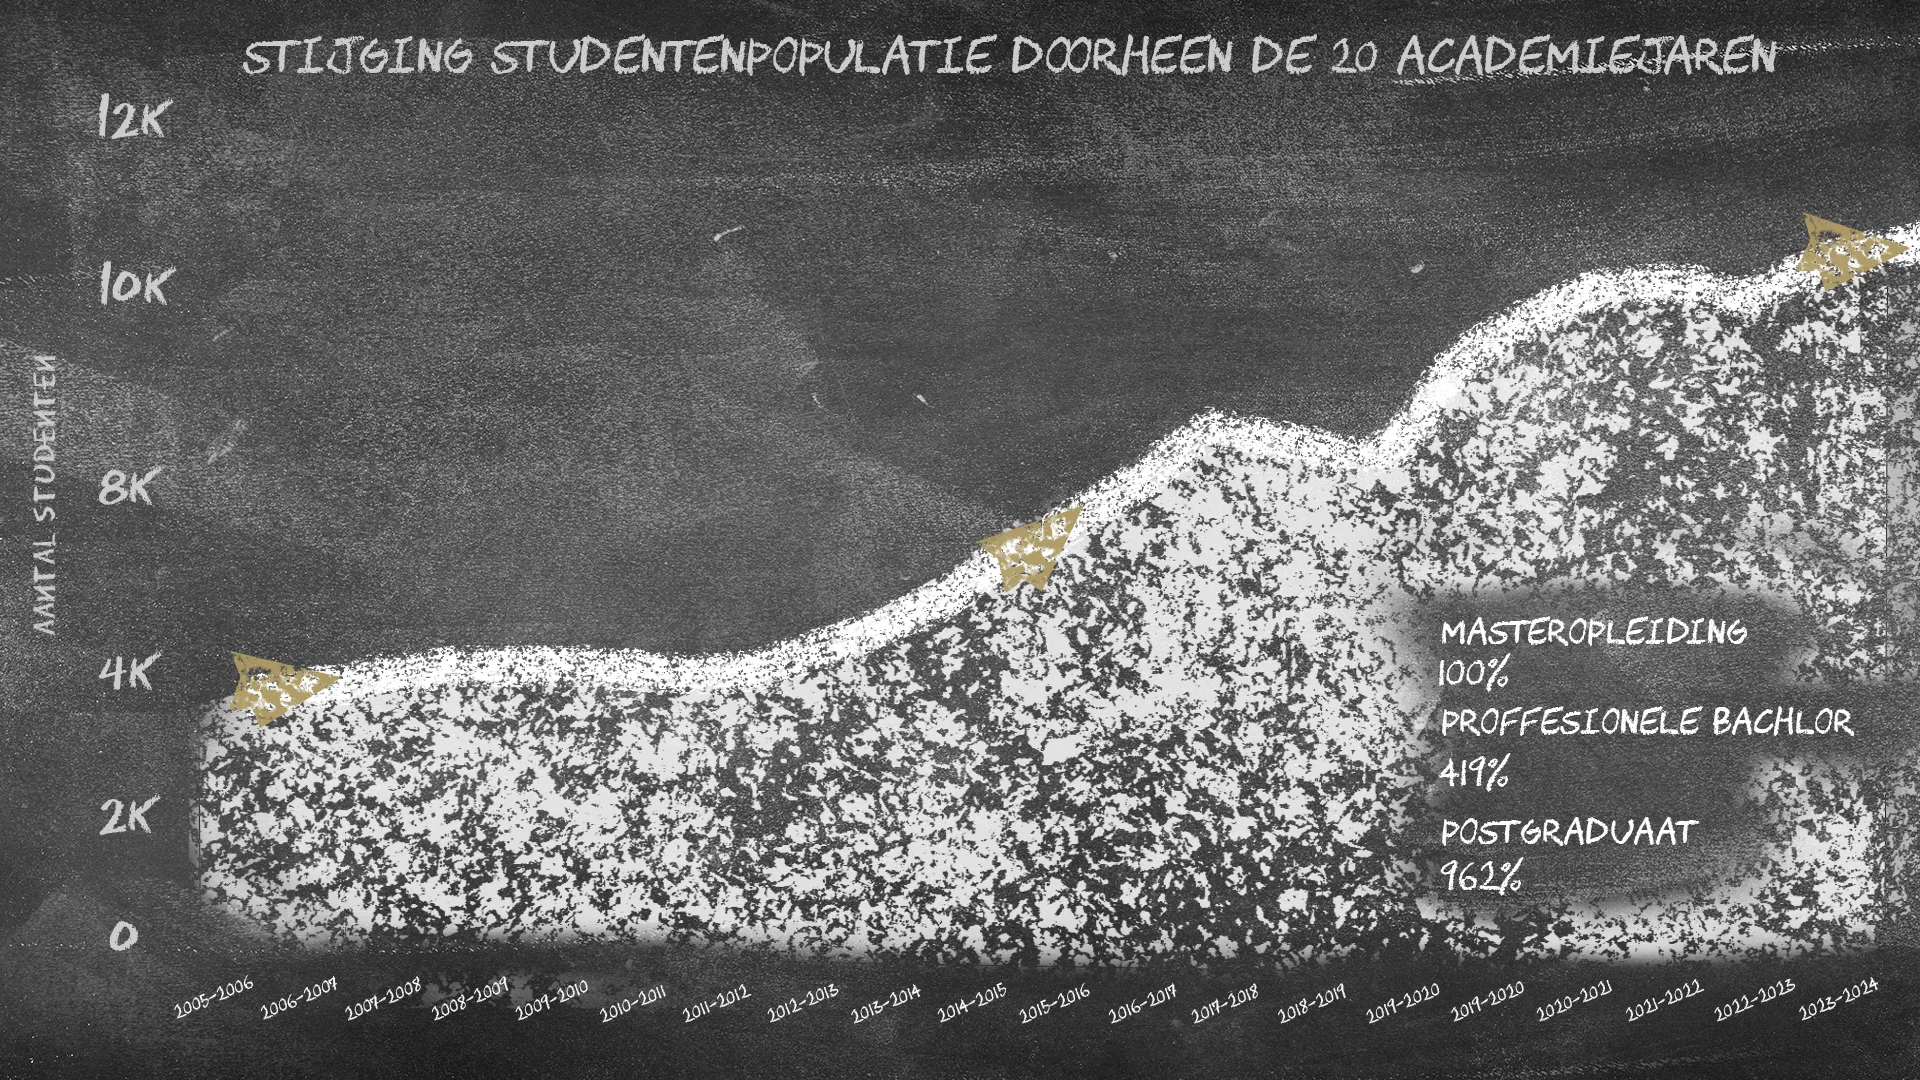
School dataviz project using Blender and Photoshop — chart hierarchy and dimensional treatments that make dense data approachable.
SECTOR
Datavizualization
WHAT I DID
Datavizualization Design, Art Direction
TECHNOLOGIES
Photoshop, Illustrator
Turn a school dataviz brief into visuals that explain information without drowning in charts.
I used Blender and Photoshop to build hierarchy, colour coding and dimensional chart treatments.
A dataviz project that makes dense information feel approachable and designed.
Your project could be next